2 May 2017

Overview

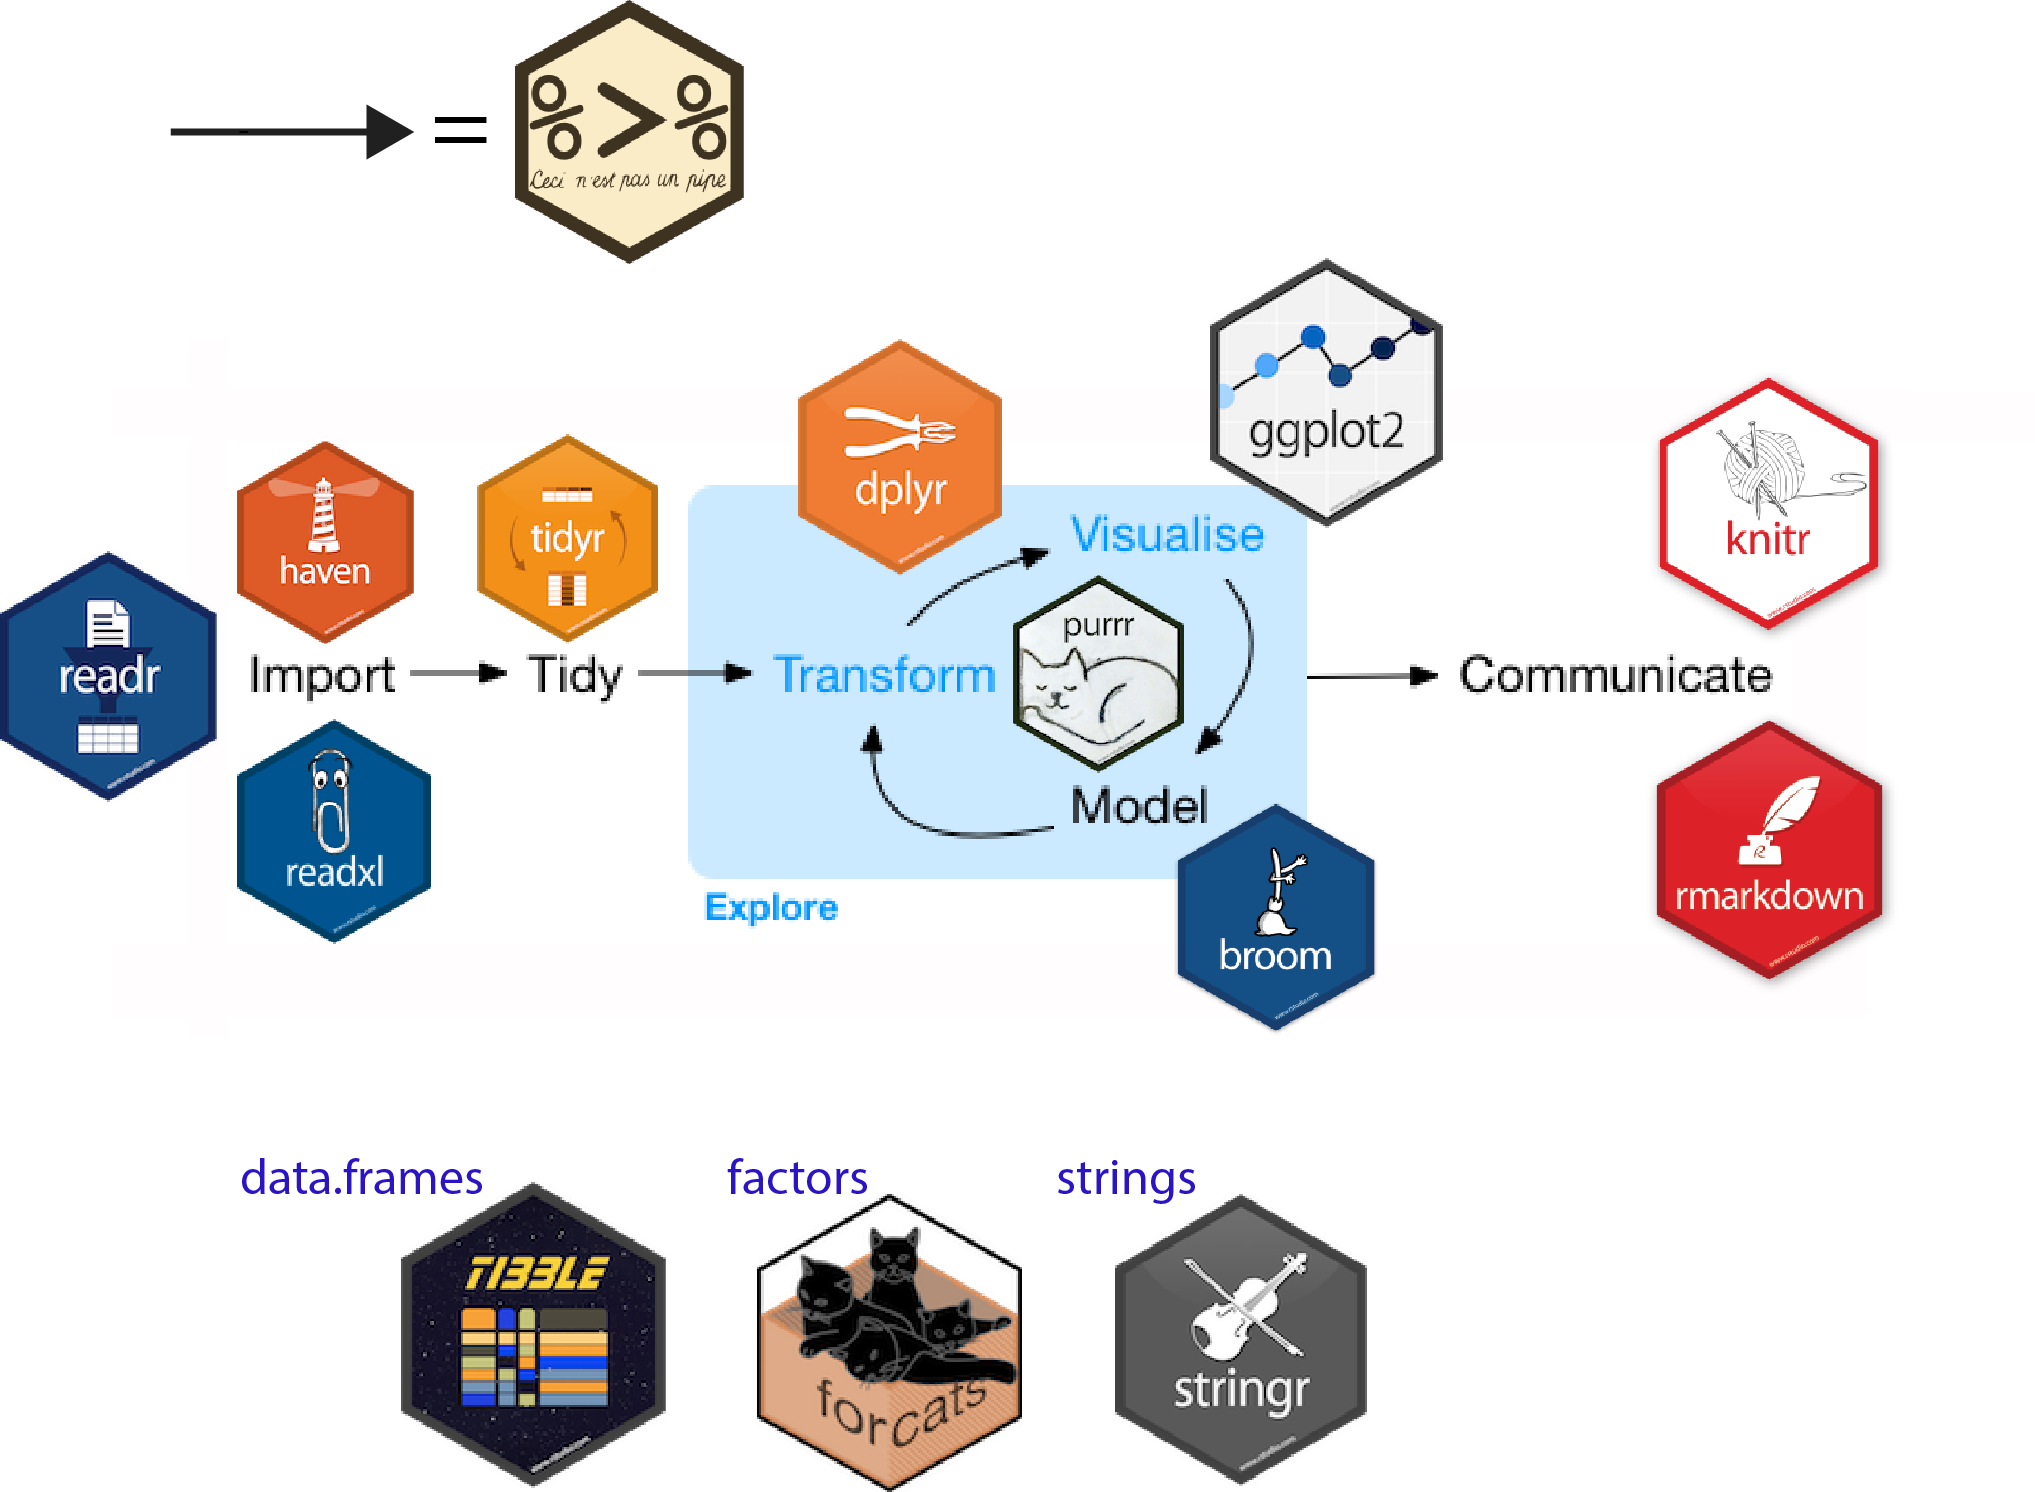
The four day course provides a complete introduction to data science in with the tidyverse. Focusing on getting data ready, some exploratory analysis, visualization and handling models.

Preparing data takes up to 90% of the time spent in analysis — speeding this up is the mission of this course

This workshop is composed of 30 hours:

lectures

  • ~ 8 hours
  • available online
  • very short exercises included
  • convert them to pdf using chrome

practical sessions

  • ~ 15 hours
  • using your own laptop
  • teachers available
  • supplementary exercises if needed

bring your own data

  • ~ 7 hours (Day 4)
  • teachers available
  • project provided for those that don't have data yet

Time table and contents

Time table

(cont.)

Day 2

Time table

(cont.)

Day 3

  • Lecture 8
    • Functional programming with purrr (EK)
  • Lecture 9
    • Handling statistical models with broom (AG)
  • [Lecture 10]
    • Programming with tidyeval (AG)

Day 4

  • Project work
    • Project (BYOD) or
    • Microarray analysis

What is R?

R is shorthand for "GNU R":

  • An interactive programming language derived from S
  • Focus on data analysis ("stats") and plotting
  • R is also shorthand for the ecosystem around this language
    • Book authors
    • Package developers
    • Ordinary useRs

Learning to use R will make you more efficient and facilitate the use of advanced data analysis tools

Why use R?

  • It's free!
  • easy to install / maintain
  • easy to process big files and analyse huge amounts of data
  • integrated data visualization tools, even dynamic
  • fast, and even faster with C++ integration via Rcpp.
  • easy to get help

Twitter R community

Constant trend

Packages

+10,000 in Jan 2017

CRAN

reliable: package is checked during submission process

MRAN for Windows users

bioconductor

dedicated to biology. status

typical install:

source("https://bioconductor.org/biocLite.R")
biocLite("limma")

GitHub

easy install thanks to devtools. status

# install.packages("devtools")
devtools::install_github("tidyverse/readr")

could be a security issue (see next slide)

CRAN install from Rstudio

github install from Rstudio' console

more in the article from David Smith

Security

Help pages

2 possibilities for manual pages.

?log
help(log)

In Rstudio, the help page can be viewed in the bottom right pane

Sadly

manpages are often unhelpful, now vignettes (and articles on tidyverse) are better and described workflows.

Drawback: Steep learning curve

Period of much suckiness

Tidyverse

creator

R base is complex, has a long history and many contributors

Why R is hard to learn

  • Unhelpful help ?print
  • generic methods print.data.frame
  • too many commands open source
  • inconsistent names read.csv, load, readRDS
  • inconsistent syntax open source
  • too many ways to select variables df$x, df$"x", df[,"x"], df[[1]]
  • […] see r4stats' post for the full list
  • the tidyverse curse

Navigating the balance between base R and the tidyverse is a challenge to learn Robert A. Muenchen

Tidyverse

creator

We think the tidyverse is better, especially for beginners. It is

  • recent (both an issue and an advantage)
  • unified
  • consistent

Hadley Wickham

Hadley, chief scientist at Rstudio, coined the tidyverse at userR meeting in 2016. He developed and maintains most of the core tidyverse packages

Tidyverse

packages

Tidyverse

packages in processes

Tidyverse

workflow

Pipeline

David Robinson

@drob on twitter

Tidyverse criticism

core / extended

Core

  • ggplot2, for data visualization
  • dplyr, for data manipulation
  • tidyr, for data tidying
  • readr, for data import
  • purrr, for functional programming
  • tibble, for tibbles, a modern re-imagining of data frames

Extended

  • Working with specific types of vectors:
    • hms, for times
    • stringr, for strings
    • lubridate, for date/times
    • forcats, for factors
  • Importing other types of data:
    • feather, for sharing with other languages
    • haven, for SPSS, SAS and Stata files
    • httr, for web apis
    • jsonlite for JSON
    • readxl, for .xls and .xlsx files
    • rvest, for web scraping
    • xml2, for XML
  • Modelling
    • modelr, for modelling within a pipeline
    • broom, for turning models into tidy data

source: http://tidyverse.tidyverse.org/ H.Wickham

Tidyverse criticism

dialect

Tidyverse criticism

controversy

Tidyverse criticism

jobs

Personal complains:

  • still young so change quickly and drastically. Backward compatibility is not always maintained.
  • tibbles are nice but a lot of non-tidyverse packages require matrices. rownames still an issue.

Anyway, learning the tidyverse does not prevent to learn R base, it helps to get things done early in the process

Tidyverse

trends

Tidyverse

trends

RStudio

Rstudio

What is it?

RStudio is an Integrated Development Environment.
It makes working with R much easier

Features

  • Console to run R, with syntax highlighter
  • Editor to work with scripts
  • Viewer for data / plots / website
  • Package management (including building)
  • Autocompletion using TAB
  • Cheatsheets
  • Git integration for versioning
  • Inline outputs (>= v1.03)
  • Keyboard shortcuts
  • Notebooks

Warning

Don't mix up R and RStudio.
R needs to be installed first.

Rstudio

The 4 panels layout

Four panels

scripting

  • could be your main window
  • should be a Rmarkdown doc
  • tabs are great

Environment

  • Environment, display loaded objects and their str()
  • History is useless IMO
  • nice git integration

Console

  • could be hidden with inline outputs
  • in the preview, embed a nice terminal tab

Files / Plots / Help

  • necessary package management tab
  • plots becomes useless when using inline outputs
  • very useful help tab

For reproducibility, options to activate / deactivate

Code diagnostics, highly recommended

The dream team

Rstudio

Working directory and projects

It is where R is looking for files (read or write).
Using the console, try:

> getwd()

setwd() or relative paths

  • It is possible to change the location using setwd() (in the console or interactively in RStudio)
  • A better way is to use projects in Rstudio

Projects

They solve most issues with working directories: get rid of setwd()

Using library()

with only base loaded

x <- 1:10
filter(x, rep(1, 3))
Time Series:
Start = 1 
End = 10 
Frequency = 1 
 [1] NA  6  9 12 15 18 21 24 27 NA

Conflicts! when 2 packages export a function

with the same name, the latest loaded wins

library(dplyr)
filter(x, rep(1, 3))

Error in UseMethod("filter_") : no applicable method for 'filter_' applied to an object of class "c('integer', 'numeric')

Solution

using the :: operator to call a function from a specific package

stats::filter(x, rep(1, 3))
Time Series:
Start = 1 
End = 10 
Frequency = 1 
 [1] NA  6  9 12 15 18 21 24 27 NA

Pipes with magrittr

developed by Stefan Milton Bache

compare the approaches between classic parenthesis and the magrittr pipeline

R base

set.seed(12)
round(mean(rnorm(5)), 2)
[1] -0.76

magrittr

set.seed(12)
rnorm(5) %>%
  mean() %>%
  round(2)
[1] -0.76

Of note, magrittr needs to loaded with either:

library(magrittr)
library(dplyr)
library(tidyverse)

Coding's style

R is rather flexible and permissive with its syntax. However, being more strict tends to ease the debugging process.

See tidyverse style's recommendations

In summary:

Good

  • use spaces
  • use more lines
    • } alone on their line except for

    r } else {

    • using the pipe %>% to display a single instruction per line
    • break list definitions, function arguments …
  • avoid using names of existing functions and variables
  • use snake_case more than CamelCases

Bad

# example from http://adv-r.had.co.nz/Style.html
T <- FALSE
c <- 10
mean <- function(x) sum(x)
# lack spaces for readibility
average<-mean(feet/12+inches,na.rm=TRUE)

Hexbins

After David Robinson' laptop, see and get inspired!

Hadley Wickham

Bob Rudis