2 May 2017

Learning objectives

Definitions

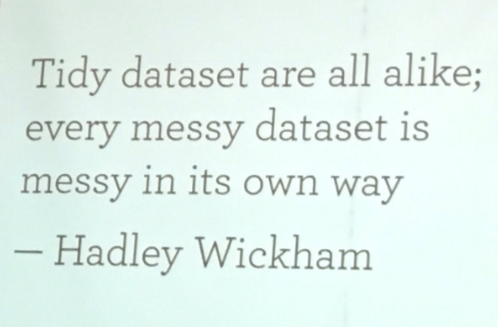
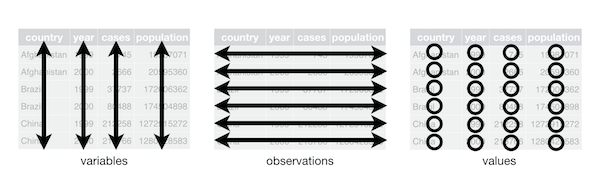
  • Principles of tidy data to structure data
  • Find errors in existing data sets
  • Structure data
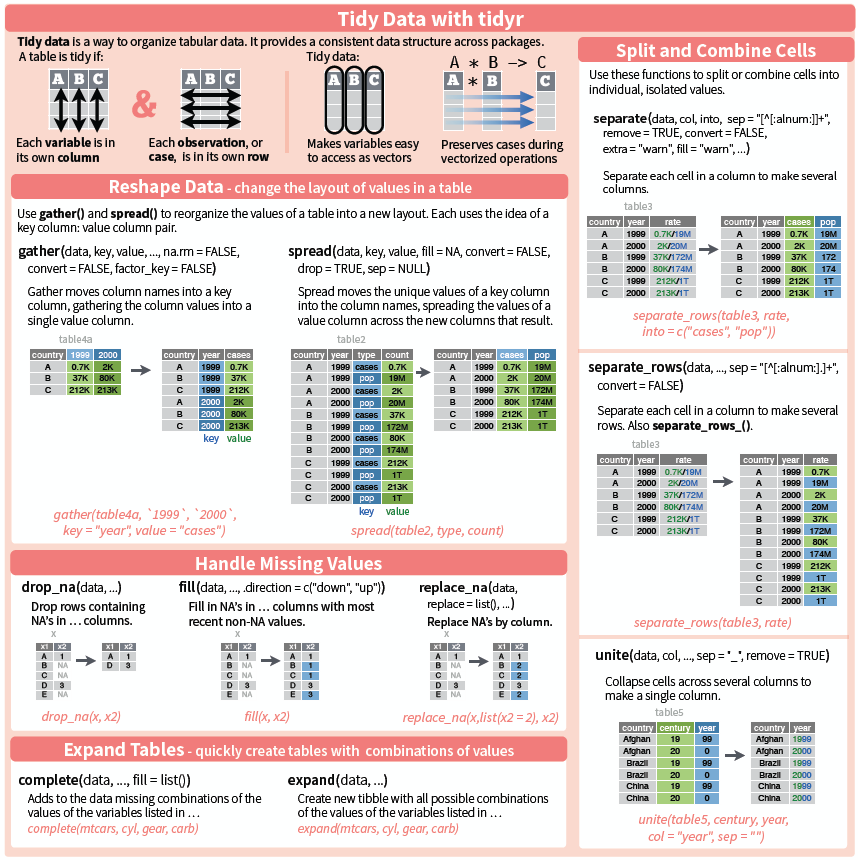
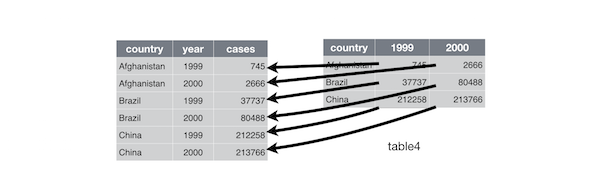
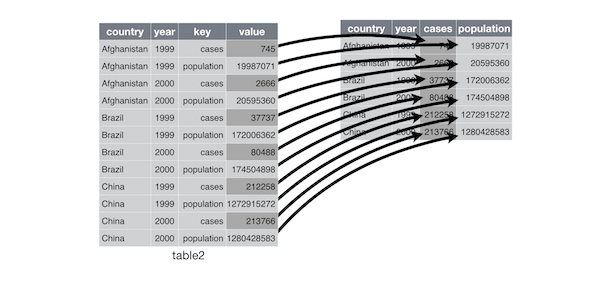
  • Reshaping data with tidyr

Comments

  • Cleaning data also requires dplyr
  • tidyr and dplyr are intertwined
  • Focus on "tidy data"
  • Introduction of tidyr ways

Rationale

Semantics

Definitions

  • Variable: A quantity, quality, or property that you can measure.
  • Observation: A set of values that display the relationship between variables. To be an observation, values need to be measured under similar conditions, usually measured on the same observational unit at the same time.
  • Value: The state of a variable that you observe when you measure it.

source: Garret Grolemund and vignette("tidy-data")

Definition

Tidy data

  1. Each variable is in its own column
  2. Each observation is in its own row
  3. Each value is in its own cell

Tidying messy data

For clean data ensure that

  • Column names are easy to use and informative
  • Row names are easy to use and informative
  • Obvious mistakes in the data have been removed
  • Variable values are internally consistent
  • Appropriate transformed variables have been added

Typical flow of data

Source data ➡️

  • Large scale data sets
    • MRI, NGS, omics data
  • Single researcher experimental data
  • External data sets
  • Manually collected data (EDC)

Intermediate➡️

Computation or manual clean up CPU or hands-on time "Tidy" data Tools: Specialized tools + shell

Analysis ➡️

Statistical analysis Exploratory and model building Hypothesis testing

Tools: R

Manuscript

Writing stage Can you reproduce your work?

  • Numbers in your paper
  • Summaries
  • Images

Tools: rmarkdown

Currently

Excel.

Currently

Word.

Bad data exercise

online

  • The following table lists missense variants in a gene in a group of patients
  • What's wrong with this Excel sheet?
  • Which problems are "tidy" issues

Tidy errors

Error Tidy violation Comment
Patient names No Data protection violation
Identical column names Yes Variable error
Inconsistent variables names No Bad practice
Non-English columns names No Bad practice
Color coding No The horror, the horror
Inconsistent dates No Use ISO8601
Multiple columns for one item Yes One observation per line
Redundant information Yes Each variable is in its own column
Repeated rows Yes Each observation is in its own row
Uncoded syndromes Yes/No Each value in its own cell
Unnecessary information (Birthdate, comments) No bad practice
Name of the table No You'll see this often

Data cleaning exercise

offline

Clean the "bad table"

  • Bring data into shape such that it conforms to tidy data requirements
  • Pay attention to details of format, less to actual data
  • Do not use R for doing the manipulations

10 min, discuss

Common tidy data violations

Problem

  • Column headers are values, not variable names (gather)
  • Multiple variables stored in one column (separate)
  • Variables are stored in both rows and columns (gather-spread)
  • Repeated observations (nest or table)
  • Multiple types in one table (dplyr data transformation)
  • One type in multiple tables (dplyr, combine into single table)

tidyr functionality

tidyr

Introduction: Cheat sheets

Convert Long / wide format

The wide format is generally untidy but found in the majority of datasets

Demo with the iris dataset

library("tidyverse", warn.conflicts = FALSE, quietly = TRUE)
as_tibble(iris)
# A tibble: 150 x 5
   Sepal.Length Sepal.Width Petal.Length Petal.Width Species
          <dbl>       <dbl>        <dbl>       <dbl>  <fctr>
 1          5.1         3.5          1.4         0.2  setosa
 2          4.9         3.0          1.4         0.2  setosa
 3          4.7         3.2          1.3         0.2  setosa
 4          4.6         3.1          1.5         0.2  setosa
 5          5.0         3.6          1.4         0.2  setosa
 6          5.4         3.9          1.7         0.4  setosa
 7          4.6         3.4          1.4         0.3  setosa
 8          5.0         3.4          1.5         0.2  setosa
 9          4.4         2.9          1.4         0.2  setosa
10          4.9         3.1          1.5         0.1  setosa
# ... with 140 more rows

Gather

"melt"

iris_melt <- iris %>%
  rownames_to_column(var = "number") %>%
  as_tibble() %>%
  gather(flower, measure, contains("al"))
iris_melt
# A tibble: 600 x 4
   number Species       flower measure
    <chr>  <fctr>        <chr>   <dbl>
 1      1  setosa Sepal.Length     5.1
 2      2  setosa Sepal.Length     4.9
 3      3  setosa Sepal.Length     4.7
 4      4  setosa Sepal.Length     4.6
 5      5  setosa Sepal.Length     5.0
 6      6  setosa Sepal.Length     5.4
 7      7  setosa Sepal.Length     4.6
 8      8  setosa Sepal.Length     5.0
 9      9  setosa Sepal.Length     4.4
10     10  setosa Sepal.Length     4.9
# ... with 590 more rows

Comments

  • contains() selection, see dplyr
  • tibbles don't have rownames

Spread

"cast"

iris_melt %>%
  spread(flower, measure)
# A tibble: 150 x 6
   number    Species Petal.Length Petal.Width Sepal.Length Sepal.Width
 *  <chr>     <fctr>        <dbl>       <dbl>        <dbl>       <dbl>
 1      1     setosa          1.4         0.2          5.1         3.5
 2     10     setosa          1.5         0.1          4.9         3.1
 3    100 versicolor          4.1         1.3          5.7         2.8
 4    101  virginica          6.0         2.5          6.3         3.3
 5    102  virginica          5.1         1.9          5.8         2.7
 6    103  virginica          5.9         2.1          7.1         3.0
 7    104  virginica          5.6         1.8          6.3         2.9
 8    105  virginica          5.8         2.2          6.5         3.0
 9    106  virginica          6.6         2.1          7.6         3.0
10    107  virginica          4.5         1.7          4.9         2.5
# ... with 140 more rows

Other uses of gather

iris %>%
  gather(flower, measure, 1:4) %>%
  ggplot() +
  geom_boxplot(aes(x = Species, y = measure, fill = flower))

Basic data cleaning

Separate rows

From ugly tables

Multiple values per cell

patient_df <- tibble(
    subject_id = 1001:1003, 
    visit_id = c("1,2,3", "1,2", "1"),
    measured = c("9,0, 11", "11, 3" , "12")  )
patient_df
# A tibble: 3 x 3
  subject_id visit_id measured
       <int>    <chr>    <chr>
1       1001    1,2,3  9,0, 11
2       1002      1,2    11, 3
3       1003        1       12

Note the incoherent white space

Combinations of variables

patient_df %>% 
  separate_rows(visit_id, measured, convert=TRUE) -> patient_separate
patient_separate
# A tibble: 6 x 3
  subject_id visit_id measured
       <int>    <int>    <int>
1       1001        1        9
2       1001        2        0
3       1001        3       11
4       1002        1       11
5       1002        2        3
6       1003        1       12

Comment

To split single variables use dplyr::separate

dplyr::separate()

Splitting values

Set-up

patient <- tibble(
subject_id = 1001:1006,
gender_age = paste(c("m", "f"), floor(runif(6, 21,65 )), sep="-"))
patient
# A tibble: 6 x 2
  subject_id gender_age
       <int>      <chr>
1       1001       m-24
2       1002       f-38
3       1003       m-33
4       1004       f-54
5       1005       m-44
6       1006       f-34

Key-value pairs

patient %>% separate(gender_age, c("sex", "age"), convert=TRUE)
# A tibble: 6 x 3
  subject_id   sex   age
*      <int> <chr> <int>
1       1001     m    24
2       1002     f    38
3       1003     m    33
4       1004     f    54
5       1005     m    44
6       1006     f    34

separate() and unite()

Dates

df <- data_frame(year = c(2015, 2014, 2014),
                 month = c(11, 2, 4),
                 day = c(23, 1, 30),
                 value = c("high", "low", "low"))

unite() {}

df %>%
  unite(date, year, month, day, sep = "-") -> df_unite

separate() {}

  • Use quotes since we are not refering to objects
  • Default split on non-alphanumeric characters
df_unite %>%
  separate(date, c("year", "month", "day"))
# A tibble: 3 x 4
   year month   day value
* <chr> <chr> <chr> <chr>
1  2015    11    23  high
2  2014     2     1   low
3  2014     4    30   low

complete()

Fill all combinations

Combinations of variables

patient_separate %>% 
  complete(subject_id, 
           nesting(visit_id), fill=list(measured=0))
# A tibble: 9 x 3
  subject_id visit_id measured
       <int>    <int>    <dbl>
1       1001        1        9
2       1001        2        0
3       1001        3       11
4       1002        1       11
5       1002        2        3
6       1002        3        0
7       1003        1       12
8       1003        2        0
9       1003        3        0

Warning

  • Use <NA>, not 0 for missing data in real life application
patient_separate %>% 
  complete(subject_id, 
           nesting(visit_id)) -> patient_complete
patient_complete
# A tibble: 9 x 3
  subject_id visit_id measured
       <int>    <int>    <int>
1       1001        1        9
2       1001        2        0
3       1001        3       11
4       1002        1       11
5       1002        2        3
6       1002        3       NA
7       1003        1       12
8       1003        2       NA
9       1003        3       NA

Nesting table

Structured data

nest()

patient_complete %>% 
  nest(visit_id, measured) ->patient_nested
patient_nested
# A tibble: 3 x 2
  subject_id             data
       <int>           <list>
1       1001 <tibble [3 x 2]>
2       1002 <tibble [3 x 2]>
3       1003 <tibble [3 x 2]>
  • Common data structures are hierarchical, e.g. patient-centric with repeat observations
  • Nesting allows to store collapsed tibbles and simplifies data management

unnest() {}

patient_nested %>% 
  unnest()
# A tibble: 9 x 3
  subject_id visit_id measured
       <int>    <int>    <int>
1       1001        1        9
2       1001        2        0
3       1001        3       11
4       1002        1       11
5       1002        2        3
6       1002        3       NA
7       1003        1       12
8       1003        2       NA
9       1003        3       NA

Wrap up

Covered here

  • tidyr (and dplyr) are replacing the reshape and reshape2 packages
  • tidy data
  • Further reading
    • tidyjson - Retrieve json data as nested tibbles

Acknowledgments

  • Hadley Wickham
  • Jeremy Stanley

Thank you for your attention!